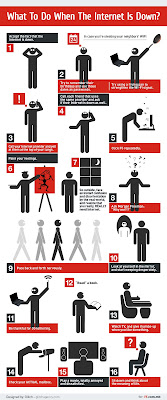
More about Infographic
-Infographics are traditionally viewed as visual elements such as signs, charts, maps, or diagrams that aid comprehension of a given text-based content. Often more powerful than words or imagery alone, infographics utilize visual elements of design and words to convey a message in such a way that context, meaning and understanding are transcended to the observer in a manner not previously experienced. However, visual representation of information can be more than just the manner in which we are able to record what has been discovered by other means. They have the potential to become the process by which we can discern new meaning and discover new knowledge. The observer becomes enlighten, having learned from the visual feast and is motivated to seek out more knowledge in this medium.
What is Spatial
-Information that describes relative positions and the spatial relationship in a physical or conceptual location.
-Is it possibly to visualize a piece of geographical map from SQL server Spatial data (geometry, not geography) in a report from reporting service?
-Is it possibly to visualize a piece of geographical map from SQL server Spatial data (geometry, not geography) in a report from reporting service?
A concrete example is to display the orange line from the Chinese subway's map in a specific reporting page.

Chronological
-Information that describes sequential position and the causal relationships in a physical or conceptual timeline.
-Basically, is Time Order. It's a loose translation but it works. When things are put into chronological order they are put in the order that they happened according to time.
Here some example:
Quantitative
-Information that describes scale, proportion, change and organization of quantities in space, time or
both.


No comments:
Post a Comment